
Introduction #
I was recently involved in a project to troubleshoot some performance issues on Azure Virtual Desktop related to some users who reported connection error “The remote resource can’t be reached” Check your connection and try again” when connecting to Azure Virtual Desktop. When the user connected 2-3 times they could eventually connect.
So I naturally started the troubleshooting by looking into Azure Monitor Insights for Azure Virtual Desktop.
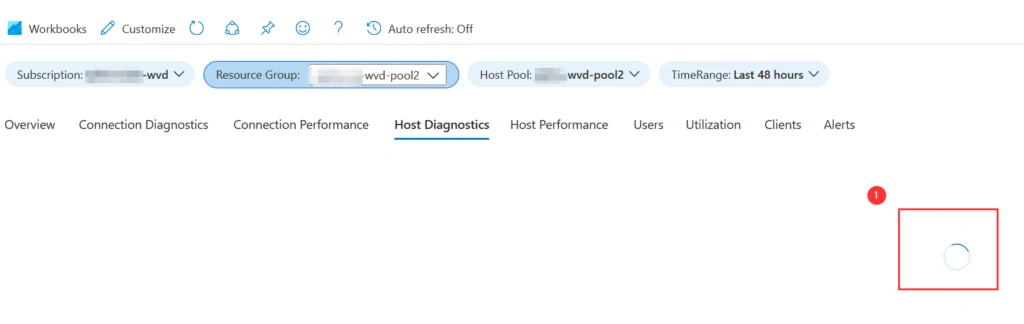
But when opening the Azure Monitor Dashboard I did not get access to the Utilization, Host Diagnostics, Host Performance, or Alerts. I could however query other tabs like connection diagnostics, connection performance, Users, Clients.
When trying to query data from Host Diagnostics the tab would start looping with the spinning wheel before it timed out, and the workspace reported: “could not query this data”.
I first suspected we could have some wrong configured counters, so I started looking the azure documentation
I looked into the performance counters and event logs to verify that they were correct. The Log Analytics workspace also did report “no missing performance counters”. I also double-checked the Terraform code, and could verify all counters were correct. Apparently, the problem was related to something else.
the next step was to jump over to the session host and check the event logs. In the event log, I could see NOT Accessible URL’s with the Event ID 3702
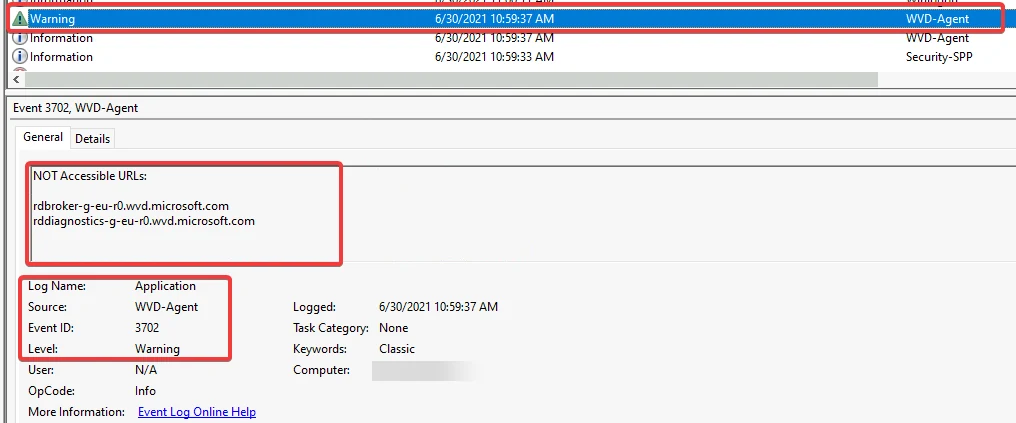
I did know that the session hosts was in a restricted network zone , so I got the network team to verify the firewall ruleset and we were missing only one URL suffix related to log analytics, but that was not relevant to the URLs from the Event ID above. Everything looked good in the firewall logs.
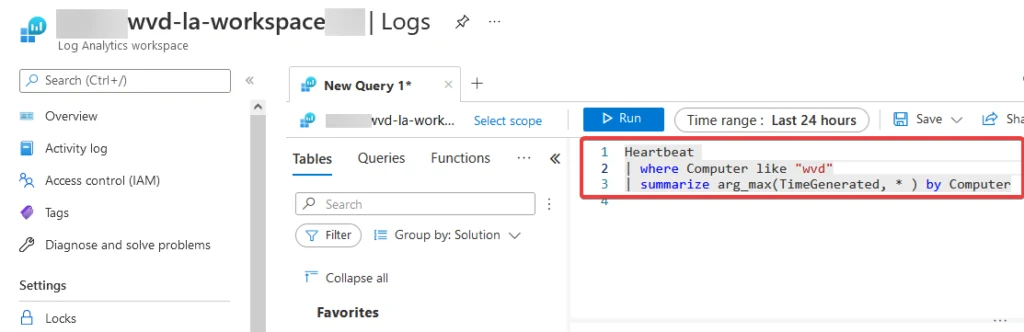
Since we still had the same issues I went into the log analytics workspace to try to Query a simple test to see if the computers were listed. I did not get any results back.
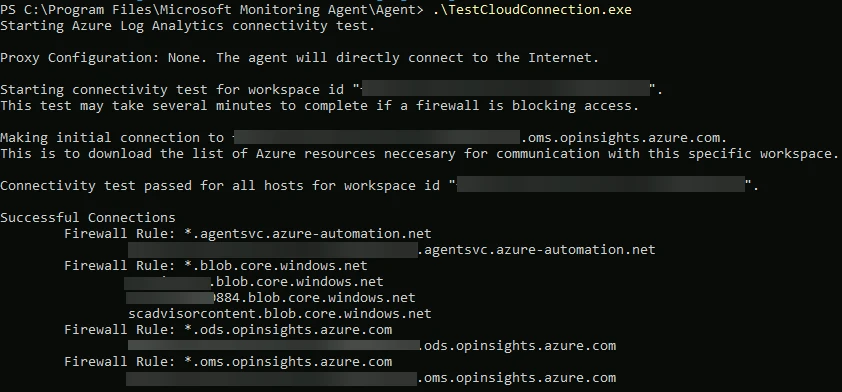
Next step was to verify that the Monitoring Agent had connection the C:\Program Files\Microsoft Monitoring Agent\Agent\TestCloudConnection.exe.
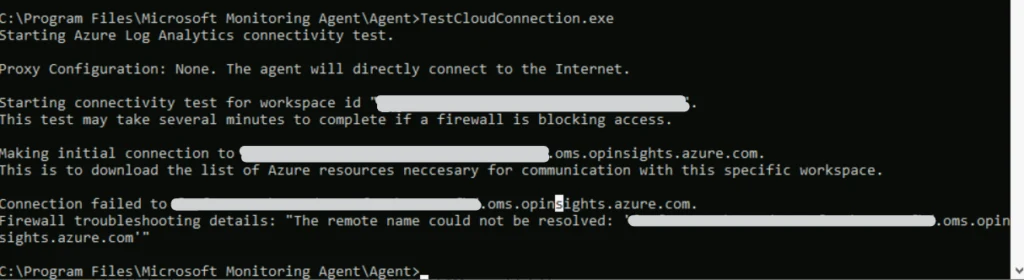
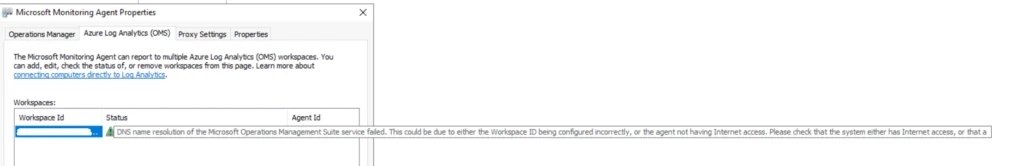
In addition, I viewed the Monitoring agent that reported status:
DNS name resolution of the Microsoft Operations Management Service Suite Failed. This Could be due to either the Workspace Id being configured incorrectly, or the agent not have internet access, please check that the system either has internet access….
Solution #
At this time It was definitely time to check DNS!
I started checking ping request against some of the URL’s and could see that ping rdbroker.wvd.microsoft.com
Ping request could not find host rdbroker.wvd.microsoft.com. Please check the name and try again.
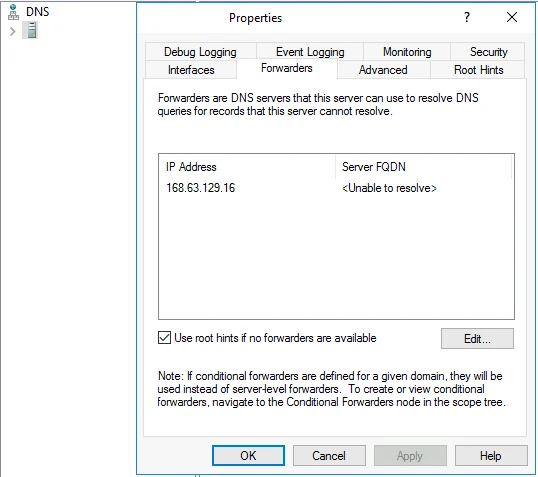
After checking the DNS servers, I could see that the forwarders were pointing to some old DNS server that was due to be decommissioned and the firewall behind the old servers was terminating the traffic. We updated the forwarder to the Azure DNS server and our traffic started flowing correctly.
I also did a quick test with the TestCloudConnection.exe, and the connectivity test passed as expected.
Summary #
This was not your everyday problem, but I just wanted to share some of the steps related to troubleshooting.
We have the Operational issue that reports status OK, but this option could be confusing because Log Analytics will report the agents as OK because is only checking the heartbeat connection between the workspace ID and the Key’s.
What could have been great is that Azure Monitor could have functionality that reported that the agent was not OK directly from the Overview tab.
Until next time! It’s always DNS